







This year’s UN World Environment Day puts climate action front and center and frames it around signals: the ones the Earth is sending us, and the ones we send back. That is exactly the right lens. So what are the signals telling us, and what are we doing about them?
When we look at the wide view on climate change, signals are both given and sent. The Earth system is telling us a great deal, so many things that it’s a little difficult to pick out the key ones. Sadly, that abundance also leaves room for confusion. A single cold spell, for example, is sometimes read as evidence against a warming world, when in truth the weather on any given day tells us very little about the long-term trend.
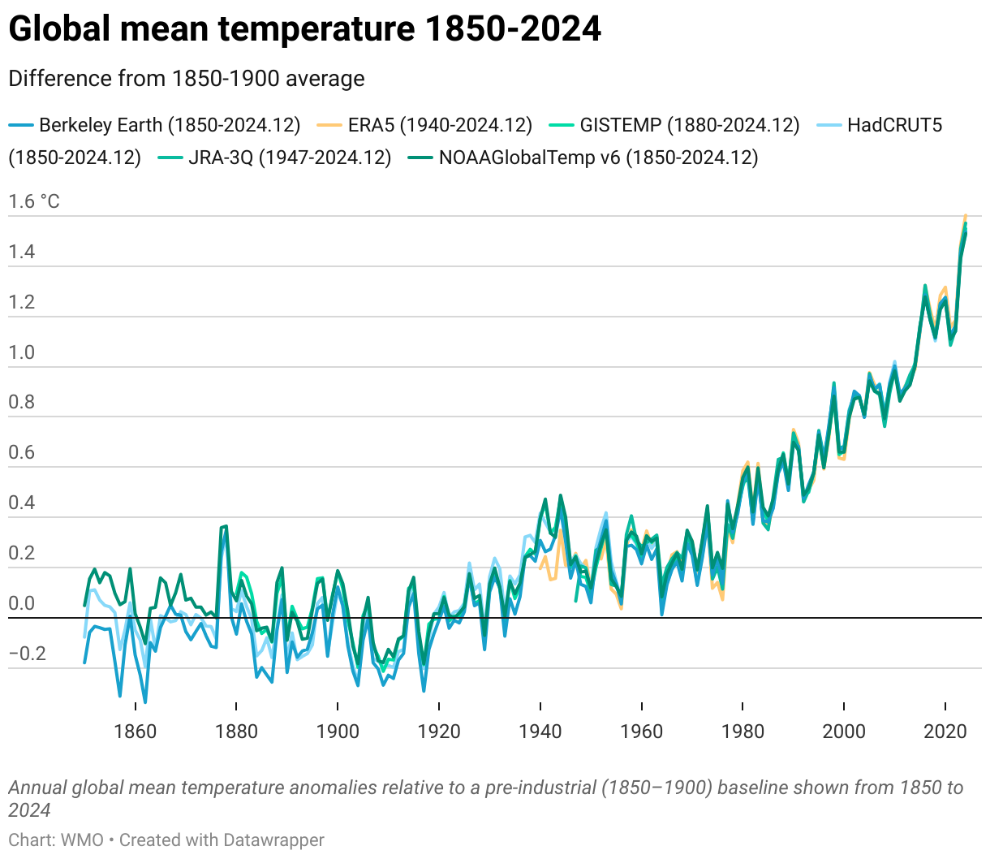
First the big one: global average temperature. There are always decadal variations in the global average, due to numerous factors such as ocean circulation patterns (El Niño, La Niña for example), the Sun’s natural variability (a roughly 11 year cycle of rising and falling output), volcanic activity (which releases aerosols that alter how much sunlight is reflected back out of the atmosphere) and year-to-year differences in ice and snow cover. These show plainly in the graph below, where the zero level on the vertical scale represents where we should be, i.e. zero change in average global temperature. Here’s the key signal from this data that’s not difficult to spot. Take a look at the pre-1960 pattern (the typical historic pattern we can trace back thousands of years) and then compare it to what is happening from 1960 onwards. After 1960, the usual year-to-year variation is still there, but trace a single smooth line through the middle of it and the pattern is unmistakable. That trend line is what concerns us: it rises steeply, signalling a rapid departure from the long-term average. The data is clear: global average temperature has risen by around 1.5°C over this period, and the change is happening remarkably fast. That might not seem like much of a temperature change but visualise the size of the Earth’s atmosphere and how difficult it would be to raise the temperature of all that air by that amount! So, signal number 1 looks pretty obvious and is further backed by some related signals: 2024 was the warmest year ever recorded; global average temperature in 2024 was 1.55°C above the 1850-1900 baseline; and the ten warmest years on record have all occurred since 2015. That’s signal stacking for you and makes the conclusions pretty solid.
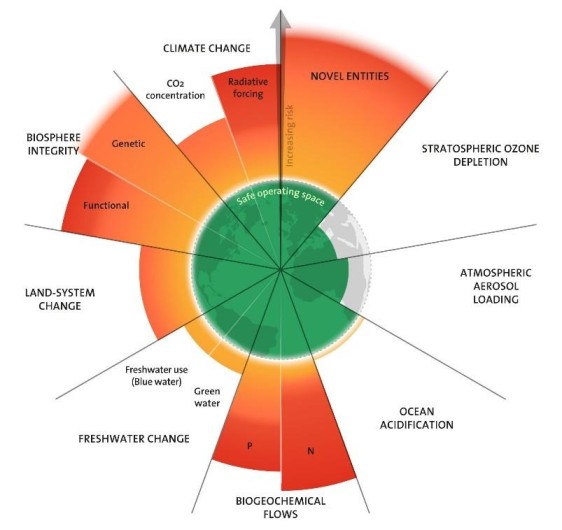
Then there are things like the Planetary Boundaries Framework, which is a useful indicator of major risks brought about by or contributing to climate change. This set of signals seeks to show how close we are to causing potentially irreversible damage to the climate, damage that could challenge the Earth’s ability to support human life. Now these indicators are much more ‘involved’ to understand than a simple average temperature, but a quick glance at the chart gives you all the signals you need to know: anything green is fine, anything orange and red is not. Out of 9 key metrics, 7 boundaries are crossed. The authors state that ‘Crossing boundaries increases the risk of generating large-scale abrupt or irreversible environmental changes,' which doesn’t sound great!
Azote for Stockholm Resilience Centre, based on analysis in Sakschewski and Caesar et al. 2025.
And if you need more, take a look at what the climate change tracker is signalling to us. It pulls together a wide range of indicators, including temperature, CO2 levels and sea-level rise, and none of them make for encouraging reading, even at a glance.
So, we’re not short of data or information. What the Earth is signalling is not a quiet whisper from the sidelines; it’s quite the choral cacophony, a plethora of signals all conveniently presented to us and easy to find if you dig just a little.
So, let’s change tack and see what signals we as a global community are sending back to the planet… do they indicate we’re listening and prepared to do something about the situation? A mixed bag is the best response I think as a summary answer to that.
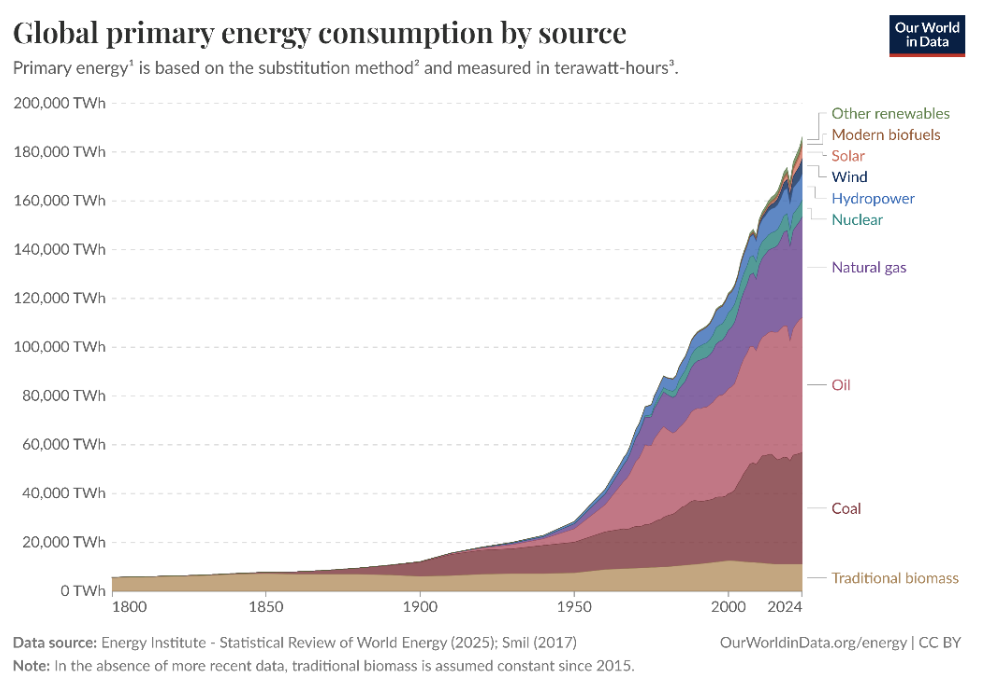
First, understanding that most of humanity’s climate impact is a result of our fossil fuel use, let’s look at what’s changing there. Our energy consumption is going up quite quickly as we modernise and industrialise globally. Take a look at the Global Primary Energy Consumption chart. In short, we use around 2% more energy each year on average, and that growth has been consistent, if a little uneven, across the period from 1990 to today. If that demand had been filled by using more fossil fuel only, climate change would have accelerated even more quickly. Some of the increase has been addressed by renewable energy — and that’s a great outcome and a good signal, especially as the rate of roll out of renewables increases every year. That renewables roll-out displaced at least some of the necessary fossil growth.
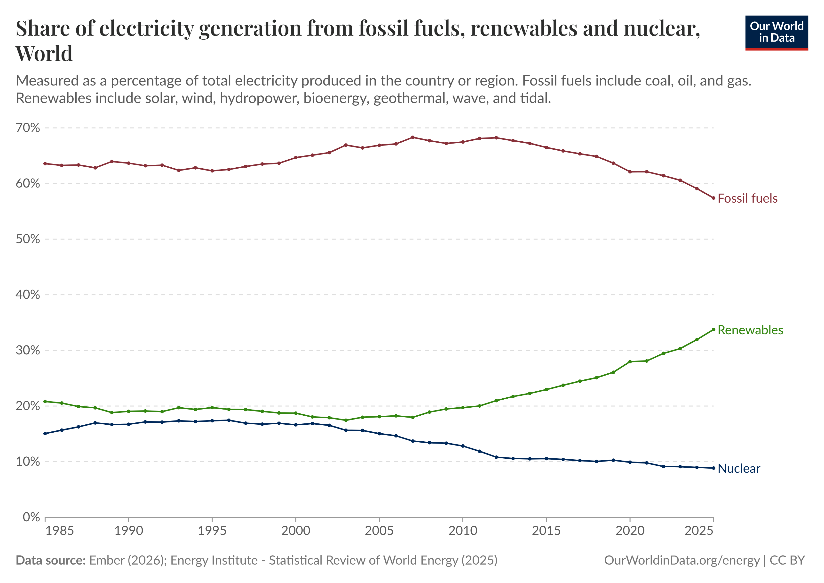
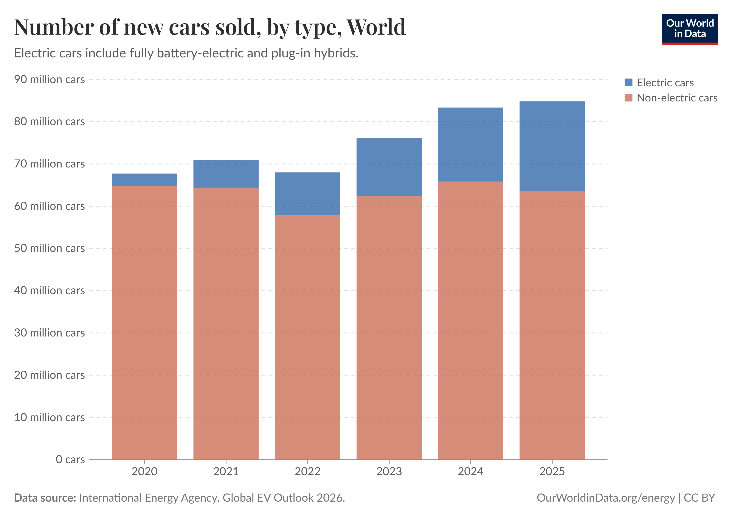
Why and how has that been achieved? Mostly through electrification of transport and industry. One of the clearest and most encouraging signals we are sending is the shift to electric vehicles. In many countries, EVs now make up more than 20% of new car sales, and in some the change has been striking: Norway, the standout example, reached a 97% EV share in 2025, with China at 53%. People are voting with their wallets, and the direction of travel is clear.
Amongst other examples, the sales of utility scale batteries, solar PV panels and heat pumps are all booming, with record sales numbers leading to truly impressive cost reductions, a beautiful virtuous circle. If these trends continue and are bolstered by other innovations and energy efficient new technology, perhaps we can say the signs we are sending are reasonably positive overall? But let’s be clear, we need improvements in technology to make sustainable solutions more cost effective than their traditional competitors if this pathway is to reach its full potential. Fortunately, recent history is telling us clearly that when the sustainable solution is cheaper, faster, better, more efficient, adoption rates rise very rapidly, despite any other external influences that might emerge.
To summarize: The Earth is being increasingly clear about the track we’re on, through rising temperatures, changing weather patterns, melting ice and rising seas and a plethora of other scientifically and rigorously observed signals. But if we choose to be climate optimists, and there is good reason to be, other encouraging signals are emerging alongside: record renewable deployment, accelerating investment in clean technology, growing climate awareness, and millions of individual and organisational decisions all moving in the same, more sustainable direction.
At the Technology Innovation Institute (TII), this is exactly the work we are committed to. Our Renewable and Sustainable Energy Research Center (RSERC) is advancing solutions across renewables, water technologies and sustainable agriculture, and the signals of our commitment are clear.
World Environment Day 2026 is therefore not just about the signals the planet sends. It is about the signals we send back. The science tells us the challenge is real. The technology tells us solutions exist. The key unanswered question is whether we choose to move fast enough to avoid the more irreversible and serious impacts of our activities on this singularly beautiful planet.